Solving Systems of Inequalities by Graphing Worksheets
If you're a math teacher or parent looking for a practical and effective way to help students master solving systems of inequalities by graphing, we have just what you need - worksheets! These worksheets are designed to provide plenty of practice and reinforce the concepts of graphing linear inequalities and finding the solution region. With clear instructions and a variety of problems, these worksheets will provide students with the necessary skills to tackle systems of inequalities with confidence.
Table of Images 👆

 Algebra 2 Factoring Polynomials Worksheet with Answers
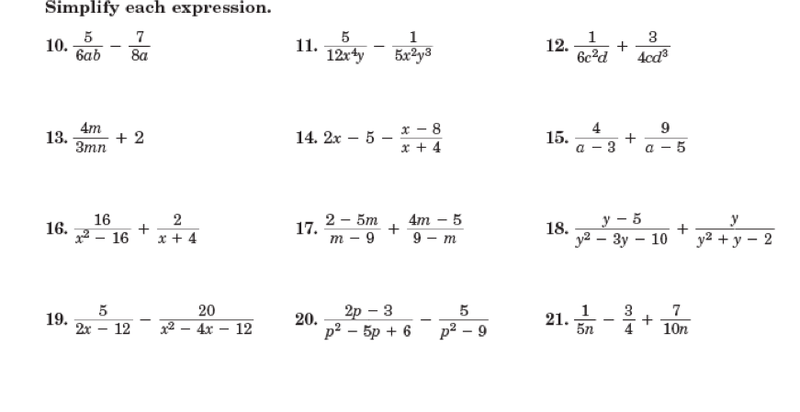
 Simplifying Rational Expressions Worksheet Answers

 Graphing Quadratic Equations Worksheet PDF
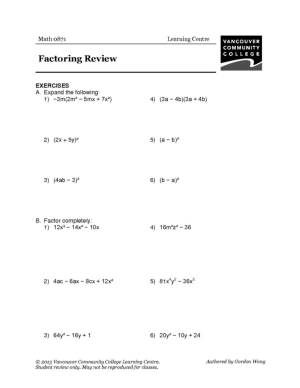
 Algebra 2 Factoring Review Worksheet
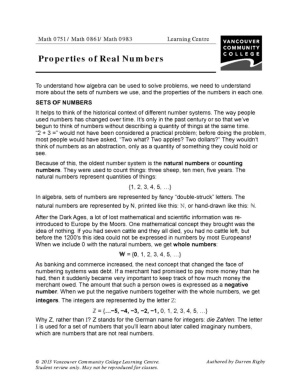
 Properties of Real Numbers Worksheet.pdf
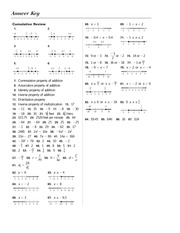
 Glencoe Algebra 2 Answer Key Chapter 5
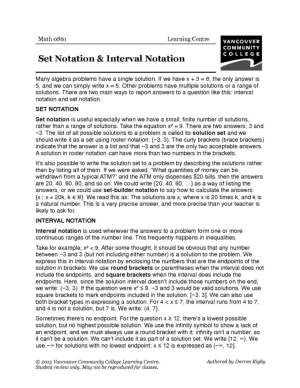
 Set and Interval Notation Worksheet
More Other Worksheets
Kindergarten Worksheet My RoomSpanish Verb Worksheets
Cooking Vocabulary Worksheet
DNA Code Worksheet
Meiosis Worksheet Answer Key
Art Handouts and Worksheets
7 Elements of Art Worksheets
All Amendment Worksheet
Symmetry Art Worksheets
Daily Meal Planning Worksheet
How do you graph a single inequality on a coordinate plane?
To graph a single inequality on a coordinate plane, first determine if the inequality is in slope-intercept form (y=mx+b). If not, manipulate the inequality to get it into that form. Then, identify the y-intercept and slope, plot the y-intercept on the y-axis, use the slope to plot additional points and draw a dashed or solid line depending on whether the inequality includes the boundary. Finally, shade the region of the graph that satisfies the inequality, typically by testing a point not on the line to determine which side of the line should be shaded.
What is the difference between a solid and a dashed line in graphing inequalities?
In graphing inequalities, a solid line is used to represent values that are included in the solution set, while a dashed line is used to represent values that are not included in the solution set. Solid lines are typically used for inequalities that involve "greater than or equal to" or "less than or equal to" relationships, while dashed lines are used for inequalities that involve "greater than" or "less than" relationships.
How do you graph a system of two inequalities on a coordinate plane?
To graph a system of two inequalities on a coordinate plane, start by graphing each inequality separately. Shade the region that satisfies each inequality. The solution to the system of inequalities is the overlapping shaded region of both inequalities. This region represents the values that satisfy both inequalities simultaneously on the coordinate plane.
What does it mean for a point to be a solution to a system of inequalities?
A point is considered a solution to a system of inequalities if it satisfies all the inequalities within the system simultaneously, meaning that when the point's coordinates are substituted into each inequality, it results in a true statement for each inequality.
How do you find the intersection points of the graphs of two inequalities?
To find the intersection points of the graphs of two inequalities, simply solve the system of equations formed by the two inequalities simultaneously. This can be done by finding the points where the two equations intersect or overlap on a graph. The intersection points represent the values where the two inequalities are simultaneously true, indicating the common solutions of the system.
What does it mean for a system of inequalities to have no solution?
A system of inequalities has no solution when the different inequalities have conflicting or contradictory conditions that cannot be satisfied simultaneously. This means that there is no single solution or set of values that satisfies all the inequalities in the system at the same time, leading to an empty or null solution set.
How do you determine the feasible region for a system of inequalities?
To determine the feasible region for a system of inequalities, you first graph each inequality on the x-y plane to represent the constraints. The feasible region is the intersection of all shaded regions that satisfy all inequalities simultaneously. This shaded region is the region where all inequalities are true and where the solution to the system of inequalities lies. You can either shade the region where all inequalities overlap or use a graphical method to find the overlapping region.
What is the graphical representation of a system of inequalities with infinitely many solutions?
The graphical representation of a system of inequalities with infinitely many solutions is typically represented by overlapping shaded regions in the graph. This indicates that there are multiple points that satisfy the inequalities and the solution set is not limited to a finite range of values. The region where the shaded areas overlap signifies the solution space where all the inequalities are simultaneously satisfied, resulting in infinitely many solutions within that region.
How can you confirm if a given point is a solution to a system of inequalities using graphing?
To confirm if a given point is a solution to a system of inequalities using graphing, you would first graph each inequality on the same coordinate plane. Then, check if the point lies in the overlapping shaded regions of all the inequalities. If the point is within the overlapping shaded regions, then it satisfies all the inequalities in the system and is confirmed as a solution.
What is the significance of shading in graphing a system of inequalities?
Shading in graphing a system of inequalities is significant because it visually represents the solution set to the system. By shading the areas on the graph that satisfy all of the inequalities simultaneously, you can easily identify the region where the solutions lie. This helps in quickly understanding and analyzing the feasible solutions of the system of inequalities.


Have something to share?
Who is Worksheeto?
At Worksheeto, we are committed to delivering an extensive and varied portfolio of superior quality worksheets, designed to address the educational demands of students, educators, and parents.


Comments